Visibility.Feedback.Results.
Two anonymized studies explore how dealer awareness relates to game pace and side-wager participation.
A clearer view of pace. More hands dealt.
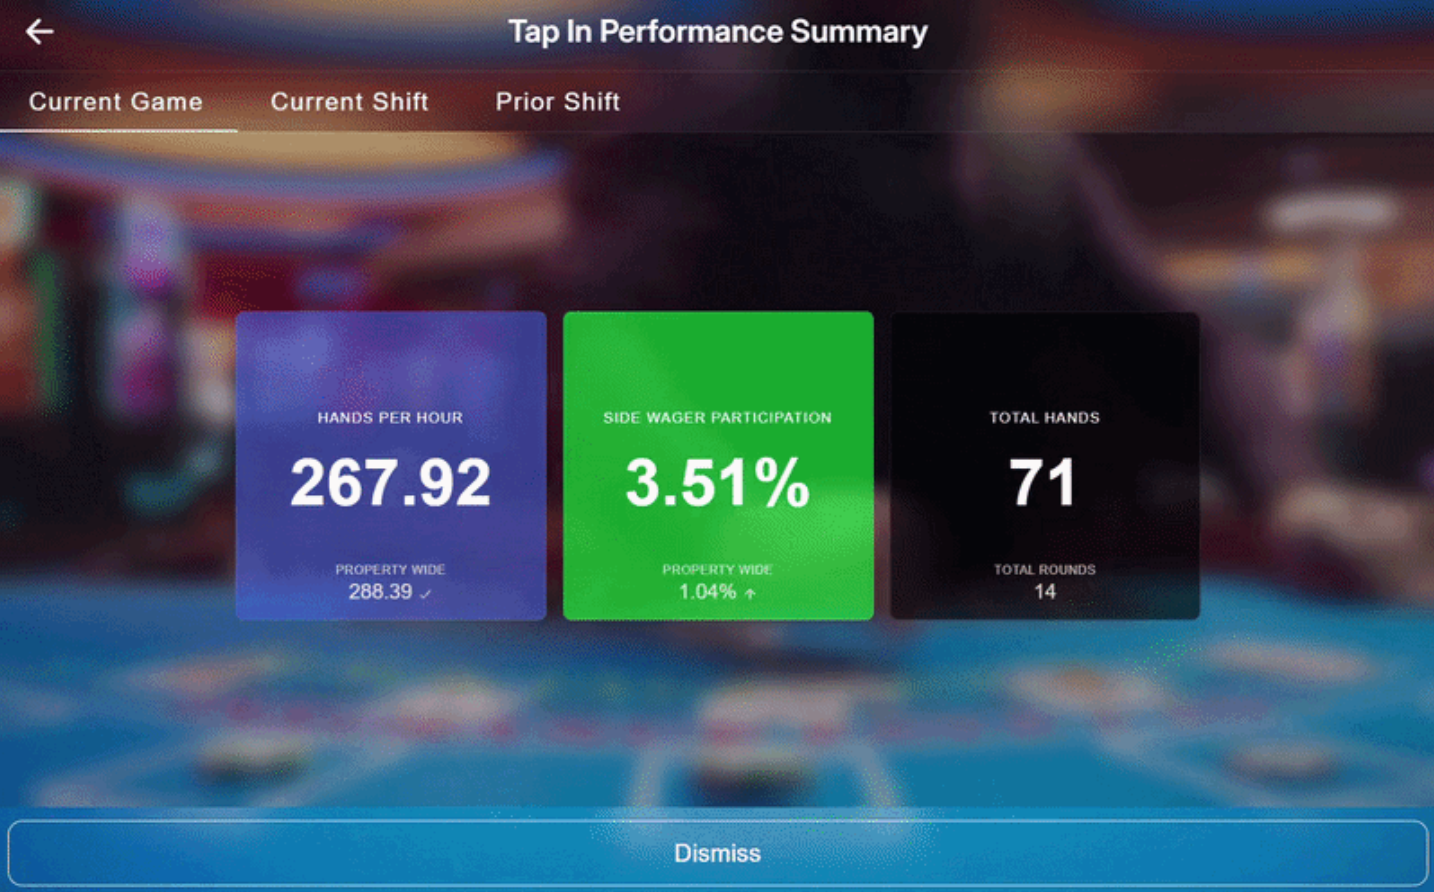
Vista Core measures table activity. TIPS gives the dealer a personal performance summary at tap-in.
- Reported increase in blackjack hands
- +5.23%
- Calculated additional hands
- ≈127,385
- Reported impact period
- 3 weeks

From observation to coaching.
Personal feedback gives dealers and supervisors a shared starting point for coaching and recognition. TIPS requires Vista Core, dealer identity and a compatible staff display.
Study scope and interpretation
Tavolo’s anonymized summary reports 5.23% more blackjack hands and 127,384.67 incremental hands over three weeks, rounded here to approximately 127,385. The incremental figure is a calculation, not an individual-hand count.
This operational comparison was not a controlled trial. Game mix, occupancy, staffing and other conditions may affect results. It is not a performance guarantee or a measure of realized casino win.
Dealer awareness. More consistent engagement.
Performance feedback keeps participation visible and supports more consistent invitations to players.
- Change in participation rate
- +2.2 pts
- More wagers at constant game volume
- +9.4%
- Reported incremental side wagers
- 29,707
Understand what changed.
The three-week summary distinguishes participation from total wager volume. Based on staff feedback, Tavolo attributes the improvement to greater dealer awareness; this is an explanation, not proof of a single cause.
- +2.2 percentage points
- Change in participation rate, not a 2.2% relative increase.
- +9.4% at constant game volume
- Separates participation improvement from changes in volume.
- 316,313 → 397,845 total wagers
- 25.8% observed growth, which can also reflect game volume.
Study scope and interpretation
The reported 29,707 incremental side wagers is different from the raw increase in total wagers. The published summary does not include the underlying table-level dataset or adjustment formula.
Results may vary with game mix, staffing, occupancy and implementation. Wager counts are not realized revenue or profit.
Your floor. Your connected table.
Choose your capabilities. See them on the table. Bring your configuration to the conversation.